Introduction
In the past few decades, school shootings have become a distressing and recurrent issue in the United States, sparking nationwide debates and prompting urgent calls for effective preventative measures. These incidents not only disrupt the educational process but also leave profound and lasting impacts on communities, spreading fear and grief across the nation. Since the Columbine High School massacre in 1999, there have been over 300 school shooting incidents that have not only escalated in frequency but have also intensified discussions on public safety and gun control, signaling an urgent need for comprehensive policy responses.
Our project investigates the complex landscape of K-12 school shootings from 1999 to 2023, leveraging comprehensive data from the Washington Post School Shooting Database. The objective is to unearth patterns and trends in these tragic events, focusing on how frequency, severity, and the characteristics of affected schools have evolved over time. By analyzing data spanning nearly a quarter century, this research aims to identify patterns and trends that shed light on the factors influencing the occurrence of school shootings. Through this investigation, the study seeks to offer insights that can inform more effective interventions and policies aimed at preventing future tragedies.
Guiding this investigation are three primary research questions:
Trends
What are the trends in K-12 school shootings in the United States from 1999 to 2023, and how have these trends evolved in terms of frequency and severity?
Demographics
How do the demographics of schools, specifically student racial composition and socioeconomic status, correlate with the incidence of school shootings in the U.S.?
Relationships
How does the shooter’s relationship to the school influence the types of school shootings most frequently experienced in the U.S.?
Literature Review
The academic landscape surrounding school shootings is varied, with researchers examining the phenomena from multiple angles, including psychological impacts, legislative effects, and social dynamics. Researchers like Gammell, Connell, and Huskey (2022) have mapped out the evolution of school shootings over five decades, revealing not only common characteristics but also unique variables that resist simple categorization. This variability underscores the need for a nuanced understanding of the myriad factors contributing to these tragedies.
Building on the theme of underlying causes, Sommer, Leuschner, and Scheithauer (2014) explore the interpersonal dynamics within schools. They identify factors such as bullying, romantic rejection, and conflicts with teachers as pivotal in escalating to violent incidents. This research connects directly with findings from Rossin-Slater et al. (2020), who examine the aftermath of school shootings, particularly their impact on youth mental health. Their study shows a marked increase in antidepressant use among young people in affected communities.
Meanwhile, Reeping et al. (2022) provide a critical look at how legislative measures, specifically state firearm laws and gun ownership, correlate with the occurrence of school shootings. Their findings suggest that tighter gun control could potentially reduce these incidents. This legislative perspective is vital, as it offers a concrete avenue for policy intervention, which can be informed by the detailed data provided by Riedman and O’Neill (2018) through their school shooting database. This database not only enhances our understanding of the incidents themselves but also serves as a benchmark for assessing the effectiveness of different safety interventions.
Despite the rich insights offered by existing studies, significant gaps and contradictions remain, particularly concerning the effectiveness of various preventative measures in the reality of school shootings. The discrepancies highlight the need for a more focused investigation into the specific underlying factors that may contribute to these violent incidents. The current body of literature underscores the necessity of an integrated approach that considers both the social dynamics within schools and the broader legislative framework. Our project responds to this by focusing on several pivotal factors first and then suggesting potential prevention strategies.
Significance
This research project on school shootings in the United States is fundamentally driven by the urgent need to enhance school safety and protect the well-being of students and educators nationwide. By dissecting the intricate dynamics of school shootings through comprehensive, data-driven analysis, our team’s project aims to uncover the pivotal factors that precipitate these violent incidents. Our analysis focuses on three crucial aspects: the accessibility of firearms, the demographics of the schools affected, and the psychological and relational profiles of the shooters. This evidence-based approach highlights the critical need for well-informed interventions and clearly defined protocols. By identifying and understanding these elements, our project provides empirical support for policies that could restrict gun access to at-risk individuals, promote equity in educational funding and resources, and enhance mental health services within schools. Our goal is to help others understand how integrated approaches to school safety can mitigate the risk of school shootings and improve the overall security and well-being of students and educators across the nation. This understanding is crucial for stakeholders at all levels—from policymakers to educators—to implement effective strategies that are informed by robust, data-driven insights.
I. What are the trends in K-12 school shootings in the United States from 1999 to 2023, and how have these trends evolved in terms of frequency and severity?
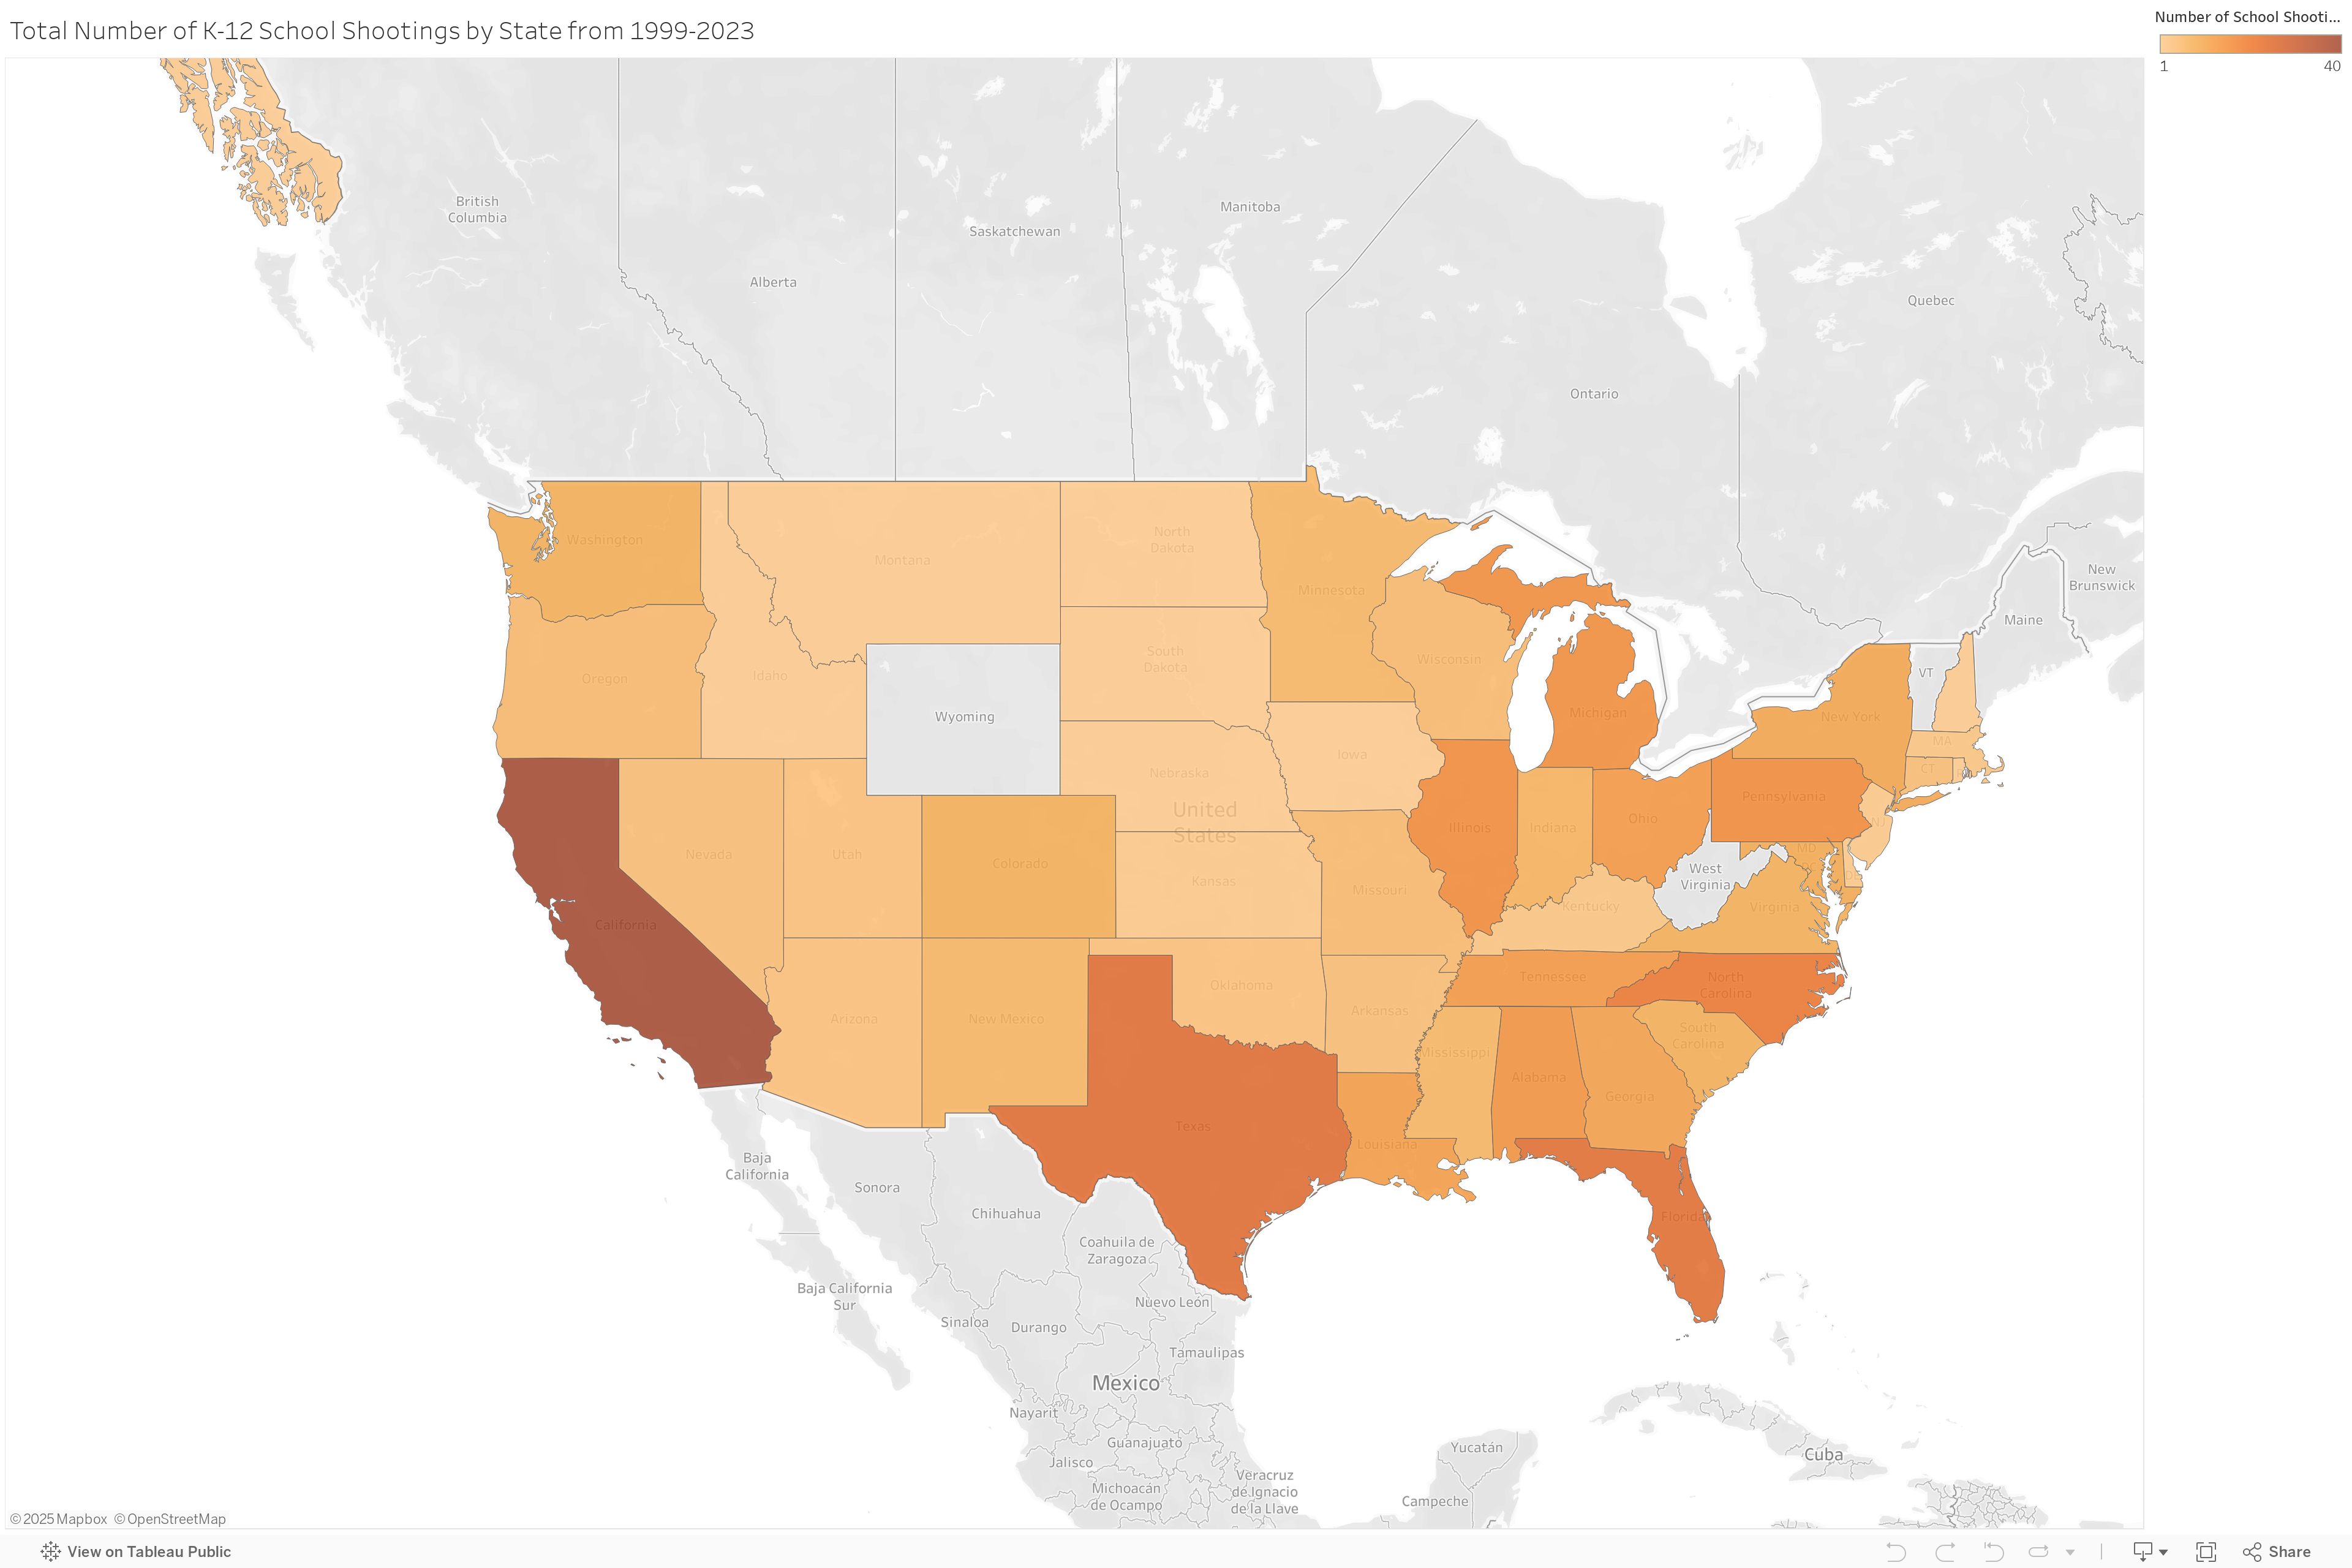
This choropleth map represents the total K-12 school shootings by state in the United States from 1999 to 2023. The map uses varying shades of orange to indicate the number of shootings, with darker shades signifying a higher count. Each state’s color corresponds to the scale on the right, ranging from 0 to 40 shootings. This map was created using Tableau.
The Columbine High School massacre that occurred in April 1999 heightened American discourse about school-related gun violence. According to the Washington Post’s K-12 school shooting database, there have been over 400 active school shooting incidents since 1999. In the recent 25 years, U.S. school shootings have risen in frequency and are now at their highest recorded levels, with the number of incidents per year initially appearing to be somewhat steady, then declining slightly, but then rising sharply in more recent years. We delve into a retrospective analysis of all school shootings and mass shootings from 1999 to 2023 by observing their demographics, timelines, and differences in trends in public and private institutions.
School Shooting Demographics
According to the geographical distribution of total K-12 School Shootings by State in 1999-2003, California has the highest number of school shooting incidents, followed by Texas, and Florida. While it may seem that these three states have the highest severity of school shootings, it should be noted that California, Texas, and Florida are the states with the top 3 highest populations within the United States, creating the appearance of more frequent and consistent incidents despite school shooting occurrences being possibly statistically different.
Another possible explanation may be that U.S. states with more permissive gun laws appear to have higher rates of mass shootings. Extreme risk protection orders (ERPOs), also referred to as red flag laws, prohibited sales to explicitly dangerous individuals beginning in 1999 and are expected to help reduce the prevalence of violent attacks (Lankford et al., 2021). Nonetheless, in cases where there may have theoretically been a legal basis for prohibiting a firearm purchase, the law is often not properly applied by the seller. Researchers from the BMJ claim that U.S. state gun laws have become more permissive in recent decades and that a growing divide in rates of mass shootings appears to be emerging between restrictive and permissive states. For example, the Texas Campus Carry Law (TCCL,) which expressly forbids all Texas higher education institutions from adopting “any rule, regulation, or other provision prohibiting license holders from carrying handguns on the campus of an institution, has seen its fatal provisions of suffering more than 19% of U.S. school shootings since 1999 (Lankford et al., 2021).
Total School Shooting Incidents Over Time
An examination of K-12 school shootings spanning from 1999 to 2023 uncovers notable patterns in the occurrence and seriousness of these devastating incidents. The Columbine High School tragedy in April 1999 was a significant event that heightened the national conversation on gun violence in schools. Subsequently, the occurrence of school shootings has increased, reaching unparalleled levels in recent years.
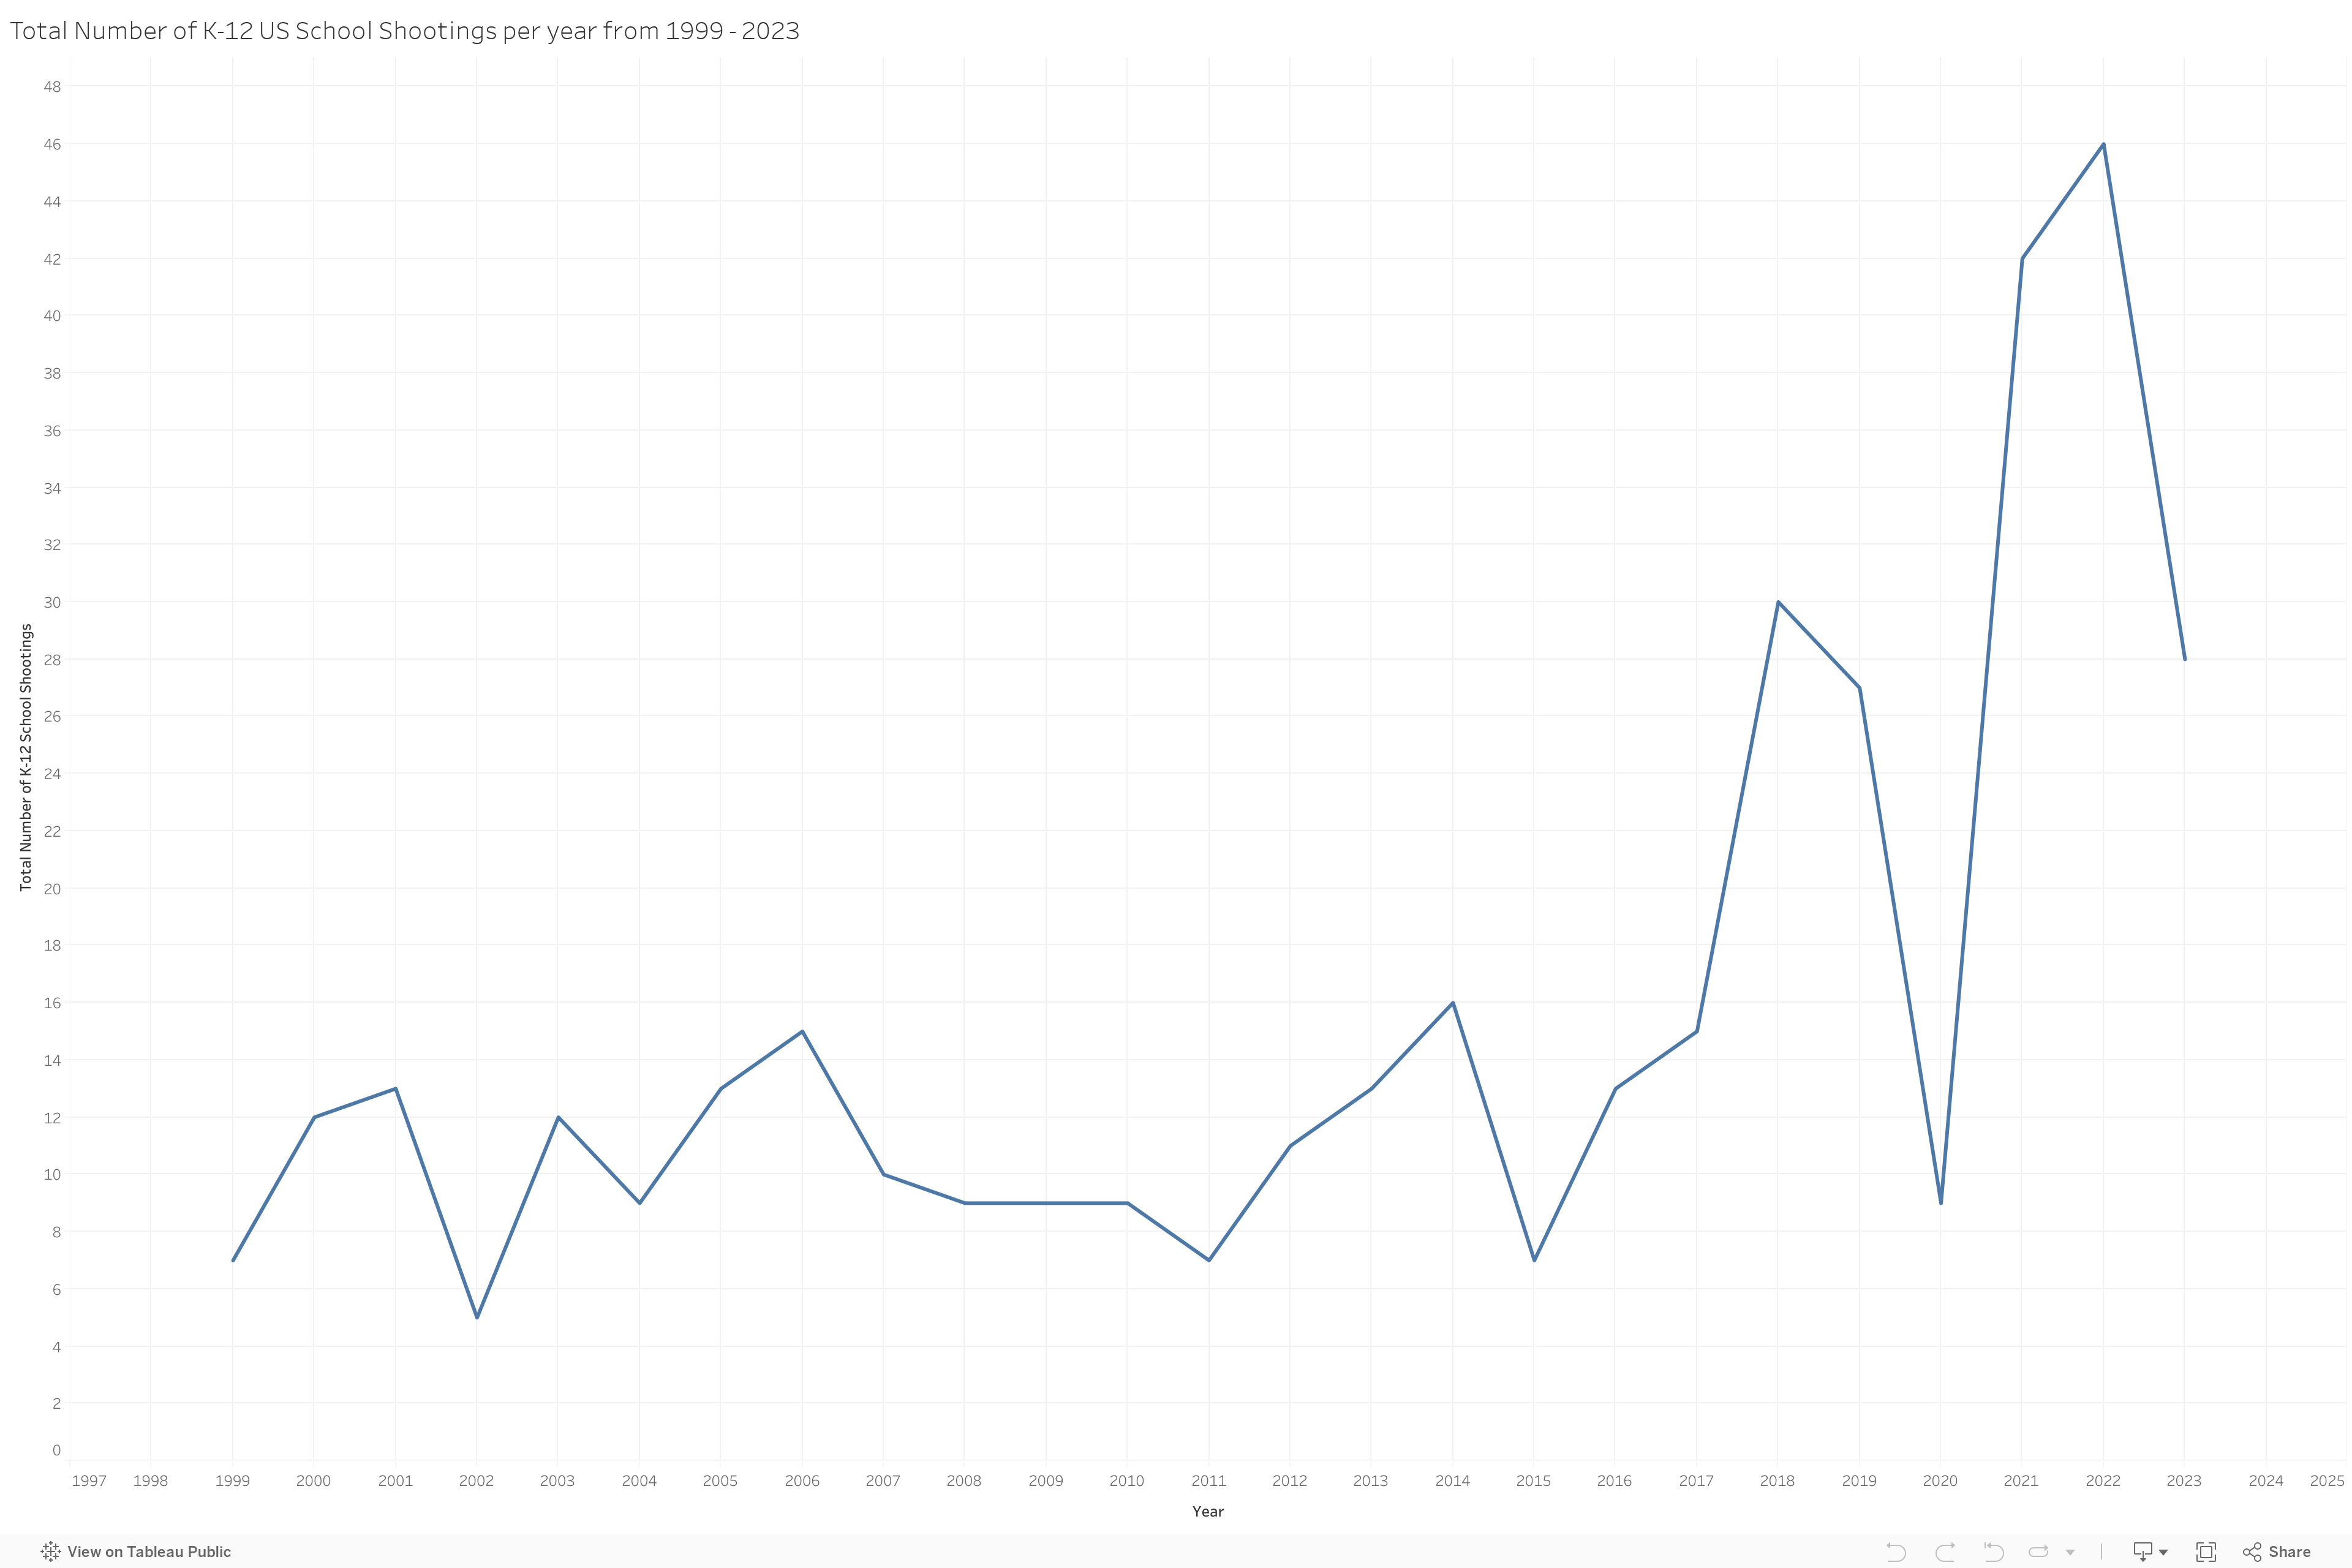
This line graph provides a detailed year-by-year account of the total number of K-12 school shootings in the United States. The vertical axis, labeled ‘Total Number of K-12 School Shootings’, ranges from 0 to 45, indicating the number of incidents each year. The horizontal axis represents the years from 1999 to 2023. The line graph reveals the fluctuating trend of school shootings over this period, with some years experiencing higher numbers than others. Notably, the past decade has seen a sharp increase in the number of incidents, indicating a rising trend in school shootings. This graph was created using Tableau.
The interactive line chart depicting total school shootings over time illustrates a concerning trend. Initially, the number of incidents per year appeared somewhat steady, with occasional fluctuations. However, in the past decade, there has been a sharp increase, indicating a rising trend in school shootings. This escalation is supported by comprehensive analyses that identify various factors influencing the severity of incidents, including the type and number of firearms used and the age of the perpetrator (Gammell et al., 2022).
Further analysis links the frequency of school shootings to state firearm laws and gun ownership rates. States with more permissive firearm laws tend to experience higher rates of school shootings. This correlation suggests that policy interventions targeting firearm regulations could potentially mitigate the frequency of such incidents (Reeping et al., 2022). The detailed records in the K-12 School Shooting Database provide valuable insights into the trends, weapons used, and characteristics of perpetrators, essential for developing targeted prevention strategies (Riedman and O’Neill, 2018).
The psychological impact of school shootings on students is profound, with significant increases in antidepressant use among young people following such incidents, highlighting the long-term mental health consequences (Rossin-Slater et al., 2020). Addressing these impacts requires robust mental health support systems within schools.
Social dynamics also play a crucial role in the occurrence of school shootings. Factors such as bullying, romantic rejection, and conflicts with teachers contribute to the development of violent behavior in students. Addressing these underlying social issues is essential for preventing future incidents (Sommer et al., 2014).
Public vs. Private Schools

This line chart presents the annual number of total K-12 school shooting victims in Public and Private schools in the United States from 1999 to 2023. The chart uses an orange line to represent private school victims, and blue line to represent public school victims. The number of victims a year ranges from 0-45. This chart was created using Tableau.
According to the Distribution of school shootings in public vs private schools from 1999 to 2023, in 2021 (the year with the highest frequency of shooting incidents), public schools suffered up to 45 attacks versus private schools, which experienced less than 5 shootings. The dramatic fluctuations in public school victims also suggest a higher severity of shootings compared to private schools.
Public schools, often located in more economically diverse areas (high poverty, large urban districts, and rural settings), are likely to be more vulnerable to resource limitations, higher student-teacher ratios, varying community support structures, and similar factors that contribute to school shootings. Columbine in Littleton, Colorado, in which two students brutally killed 12 of their classmates and a teacher on April 20, 1999, occurred in a public high school. Limited resources prevented the school from ensuring both the mental well-being of its students and the physical safety of those who were innocent, inadvertently creating the conditions for violence and encouraging the violent acts committed by others.
In contrast, the stability observed in private schools could be attributed to more controlled environments that consist of higher security measures, reflecting disparities in resource allocation and socioeconomic conditions. Examples include higher pay and higher-quality training of school leaders: teachers, guidance counselors, and administrators, who serve on the front lines of student and school needs in the U.S.
II. How do the demographics of schools, specifically student racial composition and socioeconomic status, correlate with the incidence of school shootings in the United States?
The frequency of school shootings in the US compels an examination of factors that contribute to these tragic events. Among such factors, the demographic features of schools, such as racial and socioeconomic factors, stand out as significant indicators likely to influence the likelihood and frequency where these incidents occur. This analysis investigates the complex relationship between school population demography and school shootings. It uses highly detailed data visualizations to extract patterns and insights that lay bare the profound impact these demographic elements have.
In this analysis, we hope not only to point out the extent to which these issues mirror incidents of school violence but also to highlight more significant societal and systemic issues of which these are reflections. Schools serve as microcosms of the entire community and equally reflect the inequalities and tensions interwoven in the greater society. Through understanding the demographic disparities that correspond with school shootings, we can begin working on true root causes and constructing more effective interventions that go beyond essential crisis management to fostering genuinely safe and inclusive educational environments.
The subsequent sections will explore how racial composition and socioeconomic status of school populations relate to the patterns of school shootings, supported by compelling visual data that underscores the urgency of this issue. This approach not only intends to provide clarification regarding the problem at hand but also lays a foundation for discussing solutions that address these deeply rooted challenges.
Racial Composition and School Shootings
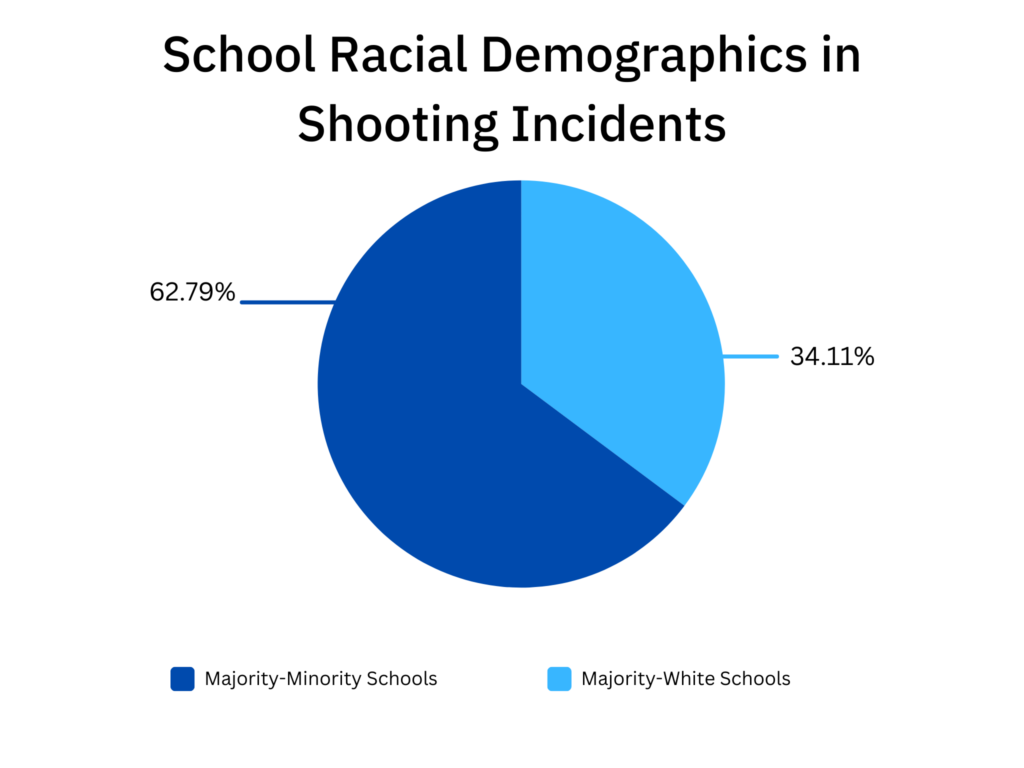
This pie chart depicts the distribution of school shootings across schools categorized by racial demographics. A significant majority, 62.79%, of these incidents occur in majority-minority schools, illustrated by a large blue segment. In contrast, the lighter blue segment shows that 34.11% of shootings happen in majority-white schools. This chart was created using Python3 for data analysis and cleaning and Canva for generating the visualization.
Analysis and Key Finding
The pie chart illustrates a troubling trend: schools with a higher percentage of non-white students disproportionately experience school shootings. This aligns with research suggesting that such schools, often located in lower-income areas, suffer from systemic inequalities like inadequate funding and higher student-to-teacher ratios, exacerbating tensions and contributing to a climate that may facilitate violence (Gammell et al., 2021).
Predominantly minority-majority schools which are often situated in lower-income areas suffer from inadequate funding and resources. These disparities can exacerbate tensions and leave schools less equipped to handle conflicts. Various studies have pointed out that these schools frequently face systemic issues such as higher student-to-teacher ratios and less access to mental health resources which could further contribute to a climate conducive to violence.
Socioeconomic Status and School Safety
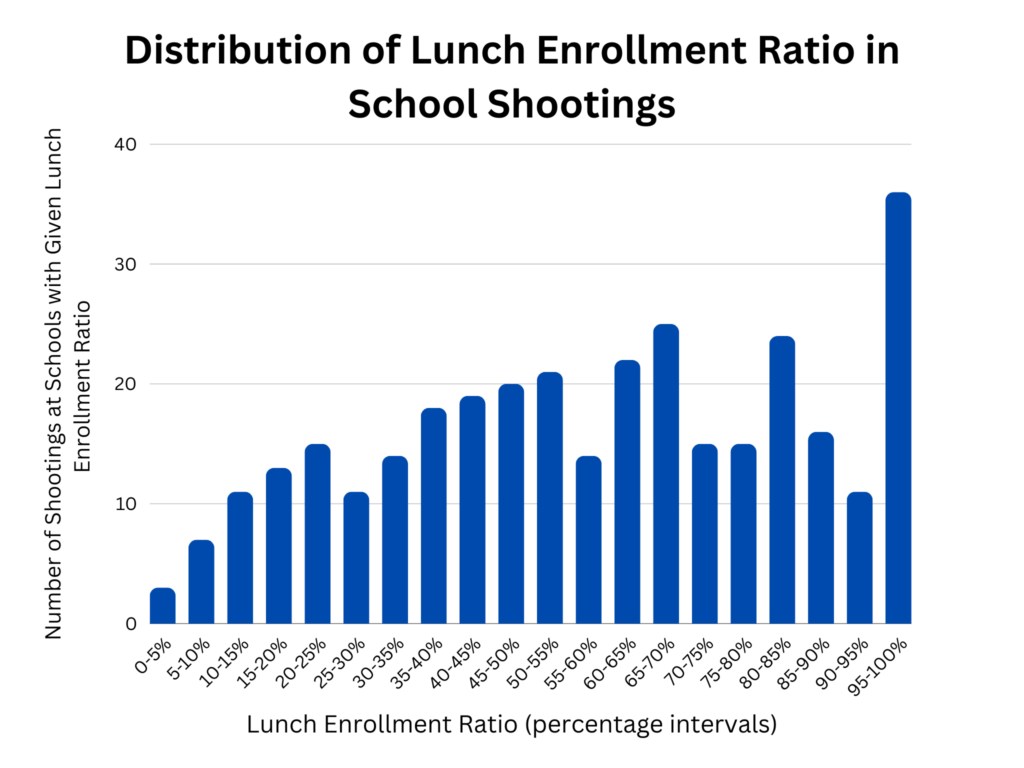
The bar chart plots the number of school shootings against intervals of lunch enrollment ratios, a proxy for socioeconomic status. The height of the bars increases with the percentage of students enrolled in free or reduced lunch programs, peaking dramatically in the 95-100% range, which indicates a high level of economic disadvantage. This chart was created using Python3 for data analysis and cleaning and Canva for generating the visualization
Analysis and Key Findings
Another critical factor is the socioeconomic status of the student body, as illustrated by the bar chart. The lunch enrollment ratio serves as a proxy for the economic status of the student population, with higher percentages indicating a greater proportion of students from lower-income families. Research, such as the findings highlighted in recent studies, supports the clear trend shown in our data: schools with a higher percentage of students receiving subsidized lunches tend to experience a greater occurrence of shootings (Gammell et al., 2021). The majority of affected schools fall within the 60-100% range for lunch enrollment ratio, with notable spikes around the 50-55% and 60-70% intervals, suggesting that schools serving these specific levels of economically disadvantaged populations are particularly vulnerable to violence.
These findings underscore the complex relationship between socioeconomic factors and school safety. The overlap between high lunch enrollment ratios, a proxy for economic disadvantage, and increased shootings indicates that economic hardship may be a significant stressor contributing to a higher risk of violence. The pressures of economic insecurity affect both students and the surrounding community members, potentially allowing it to become a breeding ground for violence. Economic insecurity is an issue that has to be grappled with in terms of these disparities through the precise provisioning of targeted support to schools serving low-income communities as part of a comprehensive approach to school violence prevention. Identifying and rectifying the underlying stressors connected to economic hardship thus creates a safe learning environment for all students without concern for their social backgrounds and financial conditions.
The conclusion will discuss essential prevention strategies and policy ideas that are critically needed to address these systemic issues that contribute to the vital issue of school shootings in the United States.
III. How does the shooter’s relationship to the school influence the type of school shootings most frequently experienced in the United States?
The Complex Profile of a School Shooter
The profile of school shooters is not defined by one set of characteristics, the aggressors can widely vary in age, sex, race, and grade. However, while there is not a single profile that could predict if someone would enact gun violence within a school, there are some commonalities that are shared among mass school shooters. Studies have found a significant proportion of the perpetrators of mass school shootings, were commonly characterized by a history of depression, poor relationships with their peers, and may have experienced social rejection, whether by a romantic breakup or their peers as well (Lankford et al., 2021). Furthermore, a study on the common characteristics of public mass shooters in all settings not solely schools found that mental health problems, suicidal thoughts, work or school conflicts, unhealthy desires for fame or attention, feelings of social isolation, and/or loneliness were common (Gammell et al., 2021). It should be noted that these characteristics we found from the literature were from perpetrators who committed mass shootings. This is important because not all school shootings are mass shootings, they have single homicides or most commonly a low casualty amount. This is evident in our dataset because many of the school shooting incidences had single homicides or low numbers of casualties. Considering this, our team was curious if there was a common characteristic among the school shooters within our dataset since it contains all types of school shootings – not just mass school shootings. Therefore, we decided to investigate the variable of the shooter’s relationship to the school itself to see if there was a frequently shared school affiliation among the shootings in our dataset.
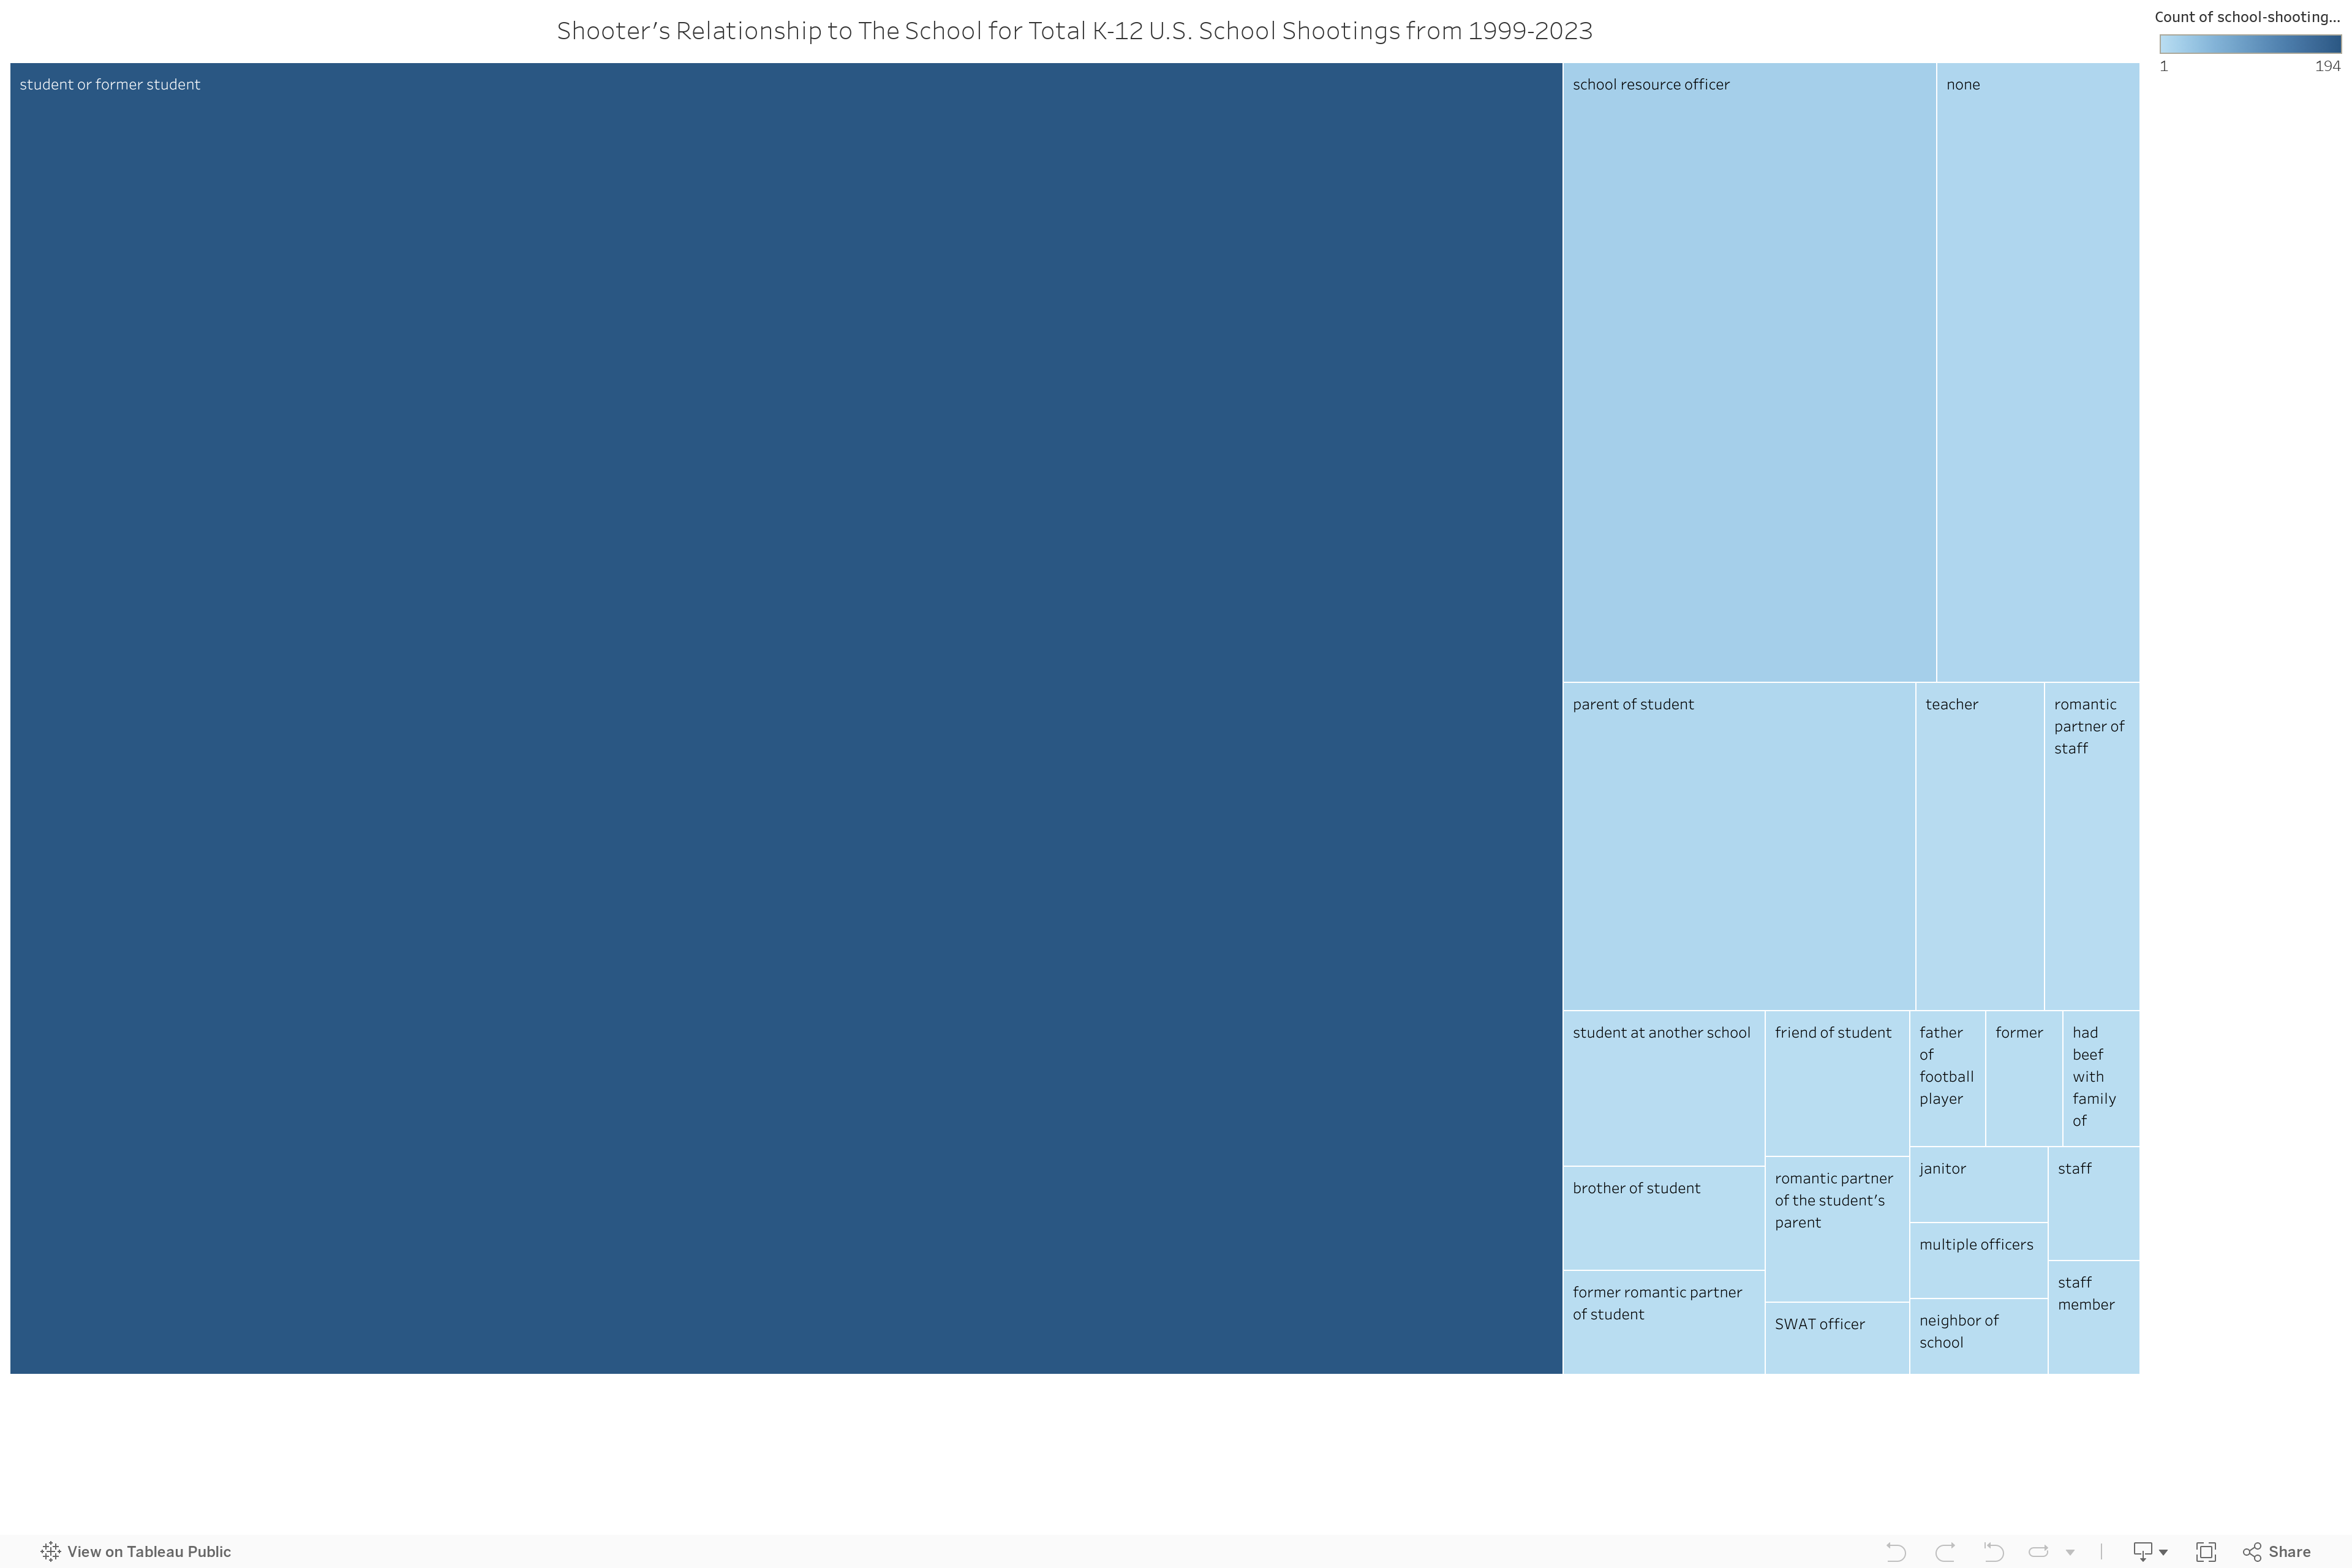
This interactive treemap portrays the different types of relationships a shooter can have with the school they attacked, focused on K-12 United States school shootings that occurred from 1999-2023. Each box represents a different type of relationship the shooter can have with the school and the size of each box represents the total number of shooters in that category. The colors also represent the total number of shooters per category on a scale of 1 to 194 with light blue representing 1 shooter and dark blue representing up to 194 shooters. Furthermore, when hovering over each box a pop-up will appear detailing the total number of shooters for each category and the percentage of each type of shooter relationship out of the total number of school shootings in the dataset. This treemap was created using Tableau.
It should be noted that 121 of the school shooting occurrences (31.27%) did not contain information on the shooter’s relationship to the shooting, therefore it was removed from this graph. For more information on this process and the data cleaning see our processes section here. However, even with the null data 194 school shooters were in the category of students or former students making up 50.13% of the total number of shootings. Similarly, in this graph without the null data there are still 194 school shooters who are students or former students, but making up 72.93% of the data. The second most common shooter relationship to the school is the school resource officers with 22 perpetrators (8.27%) and following that 11 perpetrators with no relation to the school at all (4.51%) This is a significant finding within our data because no matter if the shooting was characterized as a mass shooting or not, all of the school shootings incidents in our dataset most frequently have been students or former students of the schools they are committing gun violence at.
Patterns in School Shooting Incident Types
After finding that students and former students were the most common school affiliations for our perpetrators, our team wanted to investigate if there were any commonalities among the types of school shootings as well.
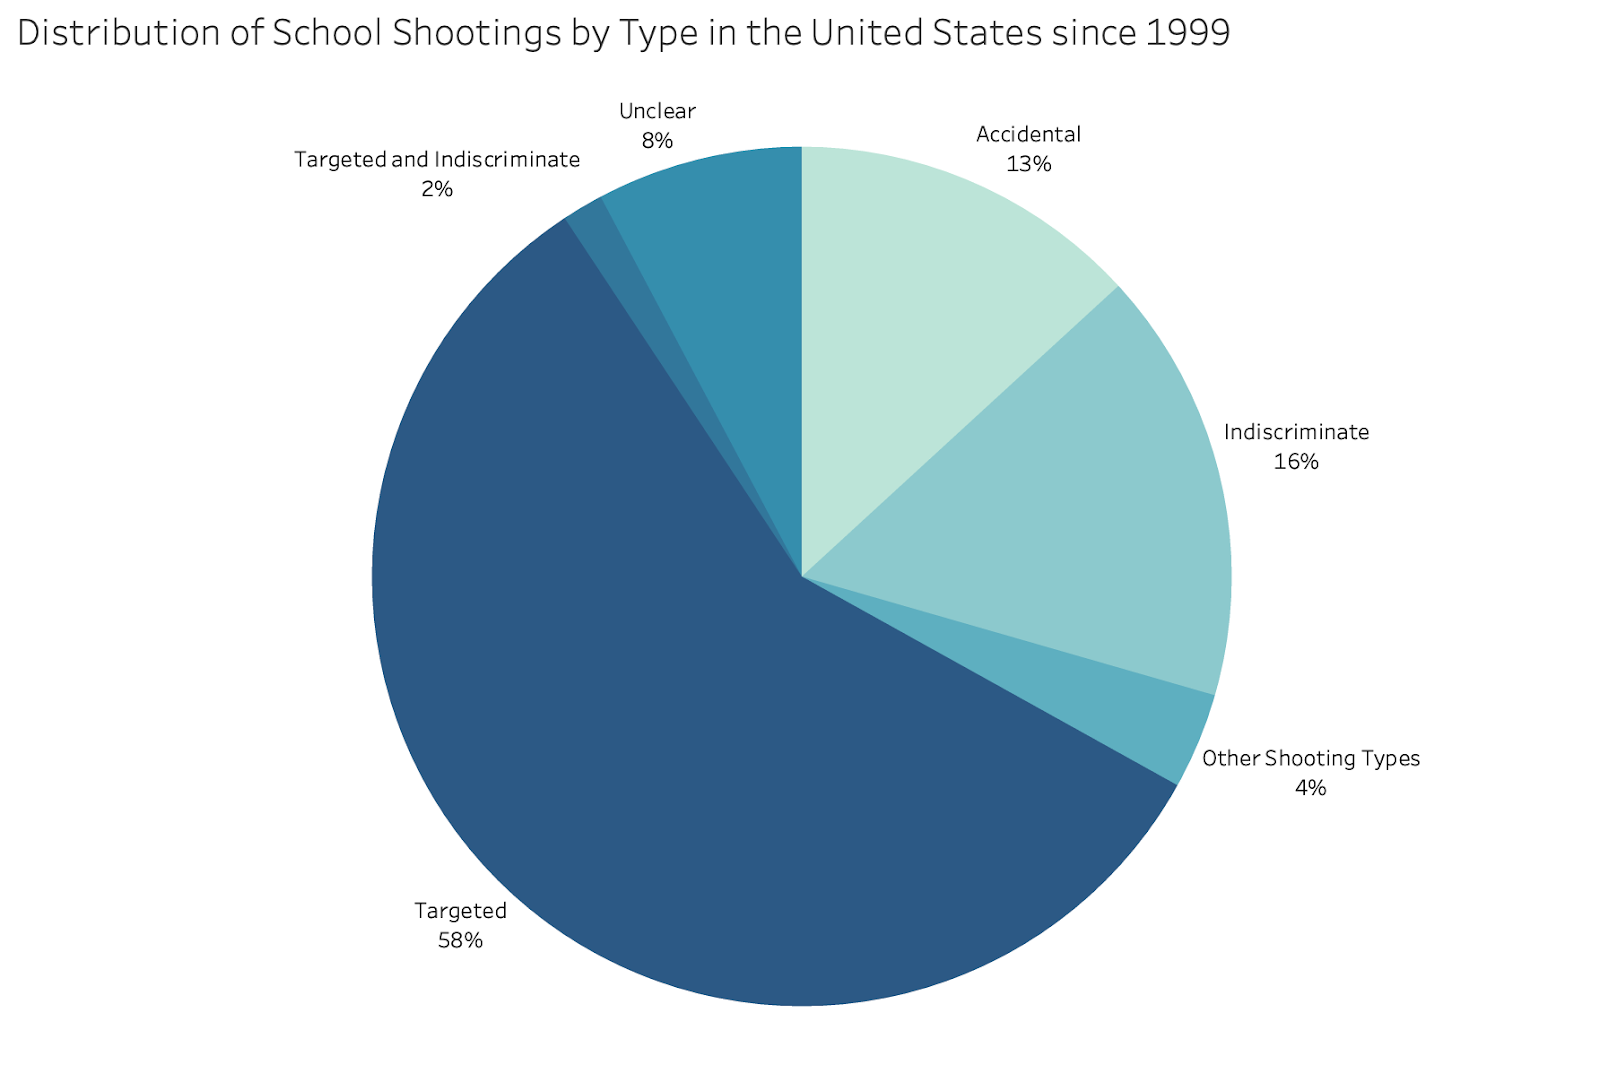
This interactive pie chart offers a comprehensive view of the distribution of the types of shootings across all K-12 school shootings that have occurred between 1999-2023 in the United States. When hovering over each category, the chart details the type of shooting and the percentage of that shooting type out of the total number of US K-12 school shootings between 1999-2023. This chart was made using Tableau.
From this graph, we can conclude that targeted school shootings are the type of shooting that has occurred the most between 1999 and 2023 among the total shooting incidents. In the Washington Post’s School Shooting database, a targeted shooting is defined as a “Shooter fired weapon purposefully with intended victim(s).” The second most prevalent type is Indiscriminate (16%), which is defined as “Shooter fired weapon purposefully but without intended victim(s)” by the Washington Post. Furthermore, the Accidental (13%) category is defined as “gun discharged accidentally.” Considering that Targeted and Indiscriminate shooting types are the most prevalent and both are defined as the shooter purposefully eliciting gunfire in school, it is evident that shooters are planning their attacks to some degree before the event. In addition, the FBI conducted a research study on multiple school shootings and found a majority of shooters indicated prior planning through drawings, school essays, other forms of written works, as well as verbal statements (Weisbrot, et al., 2023).
These findings are in alignment with prior research on shooter-school relations, which found that there is often a relationship between the aggressor and a targeted victim(s) before a targeted school shooting incident. Moreover, the literature also suggests that the act of gun violence is often the result of a disagreement between both of these parties (Gammell et al., 2021). While this statistic is true, it is not the only factor that may cause a student to participate in school gun violence. As discussed throughout our project, school shootings are a complex topic that can have a multitude of casual and influential factors on the shooter. However, after discovering that targeted school shootings are the most common type of shooting and students or former students are the most common shooter relationship to the school, our team wanted to examine if there was a correlation between these two specific variables.
Understanding Student Shooters: Possible Influences on School Violence
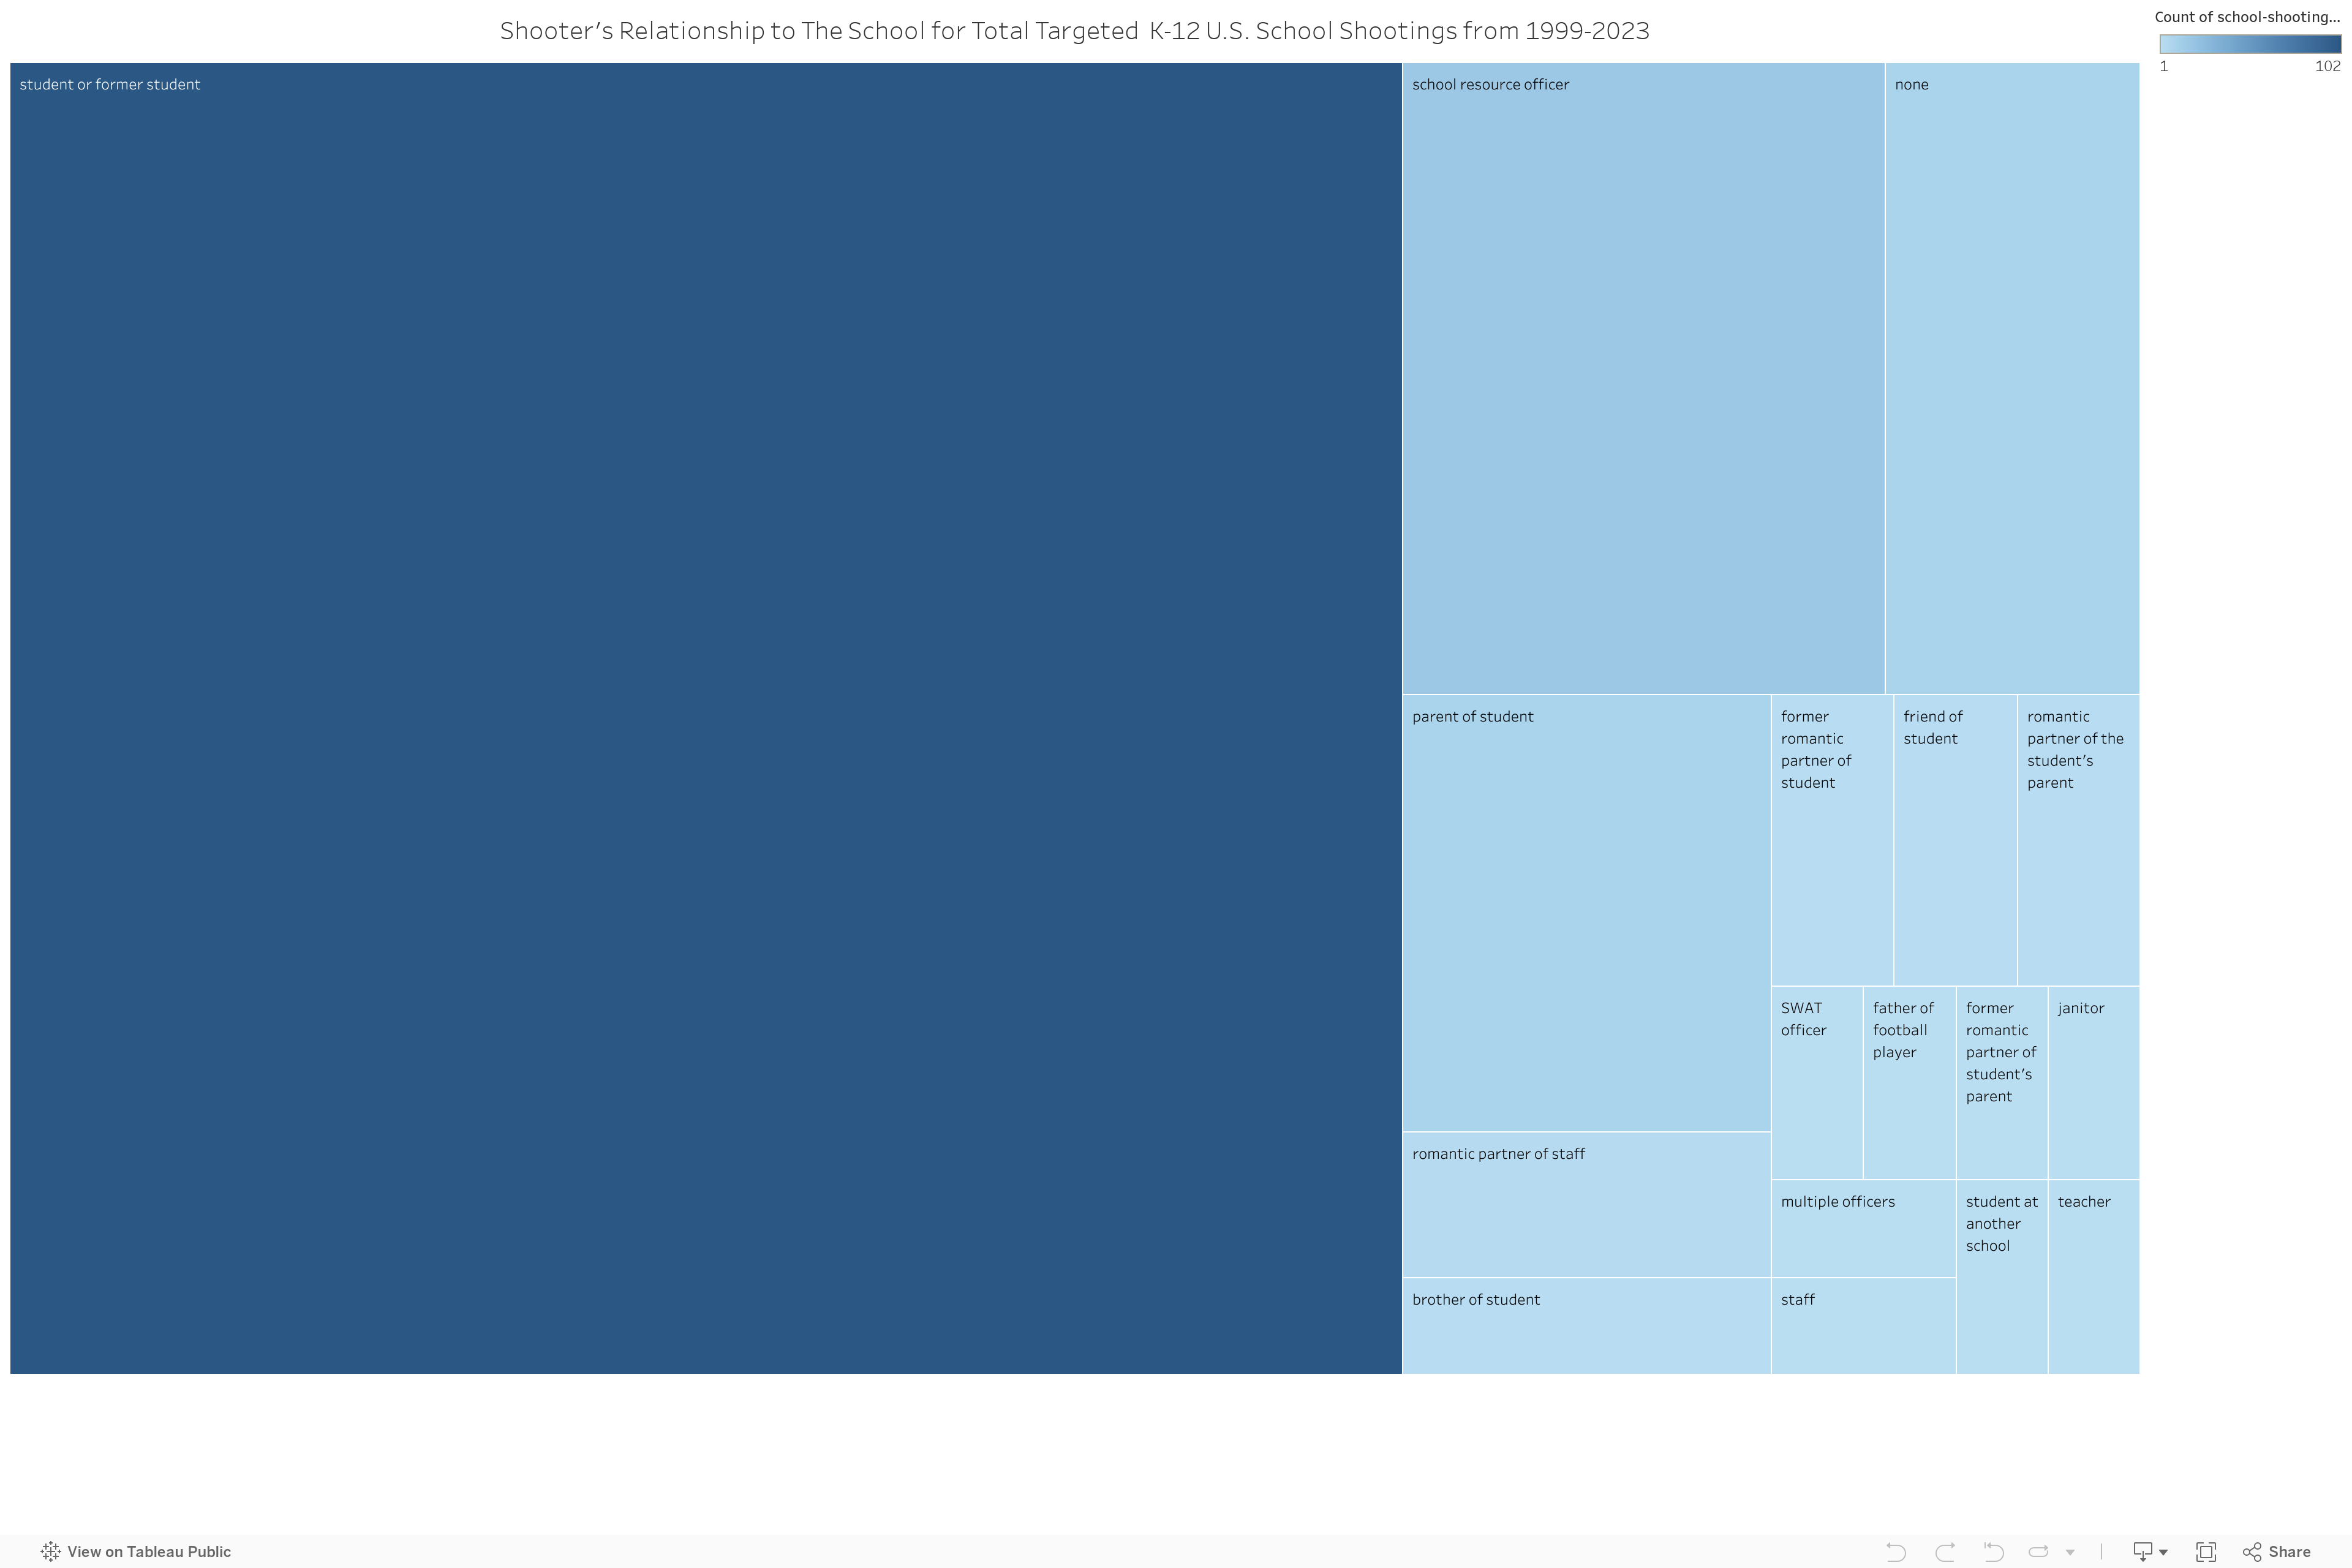
This interactive treemap portrays the different types of relationships a shooter can have with the school they attacked, focused on specifically targeted US K-12 school shootings that occurred from 1999-2023. Each box represents a different type of relationship the shooter can have with the school and the size of each box represents the total number of shooters in that category. The colors also represent the total number of shooters per category on a scale of 1 to 194 with light blue representing 1 shooter and dark blue representing up to 194 shooters. Furthermore, when hovering over each box a pop-up will appear detailing the total number of shooters for each category and the percentage of each type of shooter relationship out of the total number of targeted school shootings in the dataset. This treemap was created using Tableau.
Again, it should be noted that 121 of the school shooting occurrences (31.27%) did not contain information on the shooter’s relationship to the shooting, therefore it was removed from this graph. For more information on this process and the data cleaning see our processes section here.
However, even with the null data 194 school shooters were in the category of students or former students making up 50.13% of the total number of shootings. Similarly, in this graph without the null data there are still 194 school shooters who are students or former students, but making up 72.93% of the data. The second most common shooter relationship to the school is the school resource officers with 22 perpetrators (8.27%) and following that 11 perpetrators with no relation to the school at all (4.51%).
This graph shows that US K-12 School Shootings between 1999-2023 were the most frequently targeted shootings enacted by students and former students. Thus, showing there is a positive correlation between the targeted shooting type and current or former student variables. With this information, our project wanted to focus on the possible influences on students specifically that would motivate them to pursue such a violent act of eliciting gunfire in a school.
In the study titled “Psychiatric Characteristics of Students Who Make Threats toward Others at School.” researchers found that students who have threatened other students all share a common experience of past trauma or abuse, reported by 89.8% of the students in their study. The researchers detail these experiences as being “ bullying, teasing, physical or sexual abuse, a traumatic family event (eg, death of a loved one), or severe parental discord and/or divorce…” (Weisbrot, et al., 2023). These experiences are important to acknowledge as they can explain possible motivations for student school shooters’ acts of violence. Furthermore, this explains why some perpetrators may feel isolated and marginalized within a school setting. While this does not justify their actions, it provides insight into possible measures that need to be taken to provide mental health support and critically evaluate students who are threatening other students.
Another study that examined past school shooting cases from perpetrators who were current or former students across 13 countries found that prior conflicts with teachers were found in 43.3% of the school shooting cases they reviewed. Thus, possibly making student-teacher problems a key factor influencing the tragic development of a future attacker. This is important because if teachers are a constant factor within almost half of the shooters’ experiences, this highlights the important possible action that could be taken on how these teacher-student conflicts are dealt with. Thus, possibly aiding in the prevention of future violent shooting occurrences. Student-teacher conflicts weren’t the only possible common factor found, 88.1% of the school shooters had either “interpersonal problems/conflicts in some form (bullying, teasing, romantic rejection, and/or conflicts with teachers) within the school environment” (Sommer et al., 2014).
It should be noted that while all of these experiences that happened before the attacker initiated the shooting could be possible motivators for them, there is a lack of evidence of the shooter expressing their motives for actually enacting the shooting. In fact, in this specific study, only 38.8% of perpetrators expressed their “urge for revenge” as a personal motivation for their attacks. (Sommer et al., 2014). Considering this lack of information, it is extremely difficult to make any casual conclusions as to why school shootings are occurring. Therefore, while factors that can lead to a student becoming a future assailant are complex, commonalities experienced among school shooters such as school conflicts and past trauma need to be addressed. To prevent future shootings and to improve the overall well-being of students experiencing these discrepancies, an increase in mental health support and the quality of those services within schools is critical.
Conclusion
In conclusion, our study examining K-12 school shootings in the United States from 1999 to 2023 reveals a troubling trend of both increased frequency and severity. This rise can be explained by some facts, such as easy access to guns, lax state laws, and the school demographics. Generally, these shootings are carried out by current or former students, who often act out of personal conflicts or experiences of social rejection. Furthermore, the fact that these tragic events disproportionately affect schools in lower-income and higher-minority communities points to deeper issues of socioeconomic and racial disparities that need to be addressed.
Addressing these complex issues requires a comprehensive approach. Based on our literature review and ongoing research, several effective prevention methods have been identified. These strategies enhance school safety through a combination of three aspects: physical security measures (Jonson, 2017), mental health support (Teasley, 2018), and community involvement (Alexandros Haliassos et al, 2020). For instance, at the initial phase, systems like Colorado’s Safe2Tell allow for confidential reporting of potential threats, which can reduce the likelihood of violent incidents. During an incident, comprehensive threat assessment programs and regular emergency plans, as outlined in the “Effectiveness of Safety Measures” from SchoolSafety.gov, can help manage the situation immediately and effectively. After an incident, Martell shows that it’s crucial to provide mental health support and community healing initiatives for students. Such methods can address the trauma experienced by students and also staff. In general, these strategies emphasize proactive measures at each stage—before, during, and after a threat—to ensure a comprehensive approach to school safety.
Anecdotal evidence from school shooting survivors shows the importance of these strategies. One survivor, Lisa Hamp, from the Virginia Tech shooting, spoke of how the mental health services provided at the school helped many students cope in the aftermath (“InfraGardNCR Webinar Series”, 2019). The survivor’s experience shows that continuous support plays a critical role in fostering recovery in the face of such tragedies.
Together, the combination of strategies forms a proactive approach to school safety. How we construct a robust network for both immediate and long-term solutions in preventing school shootings is an urgent question for policymakers and school managers to think carefully about.